

Building your own dashboard
Dashboards live inside a solution. For one you build entirely yourself, start from Solusi Kosong (empty solution).
1. Create an empty solution
Open Solutions.
Press Solusi Kosong.
Give it a name, for example
Bekasi plant, then press Pasang.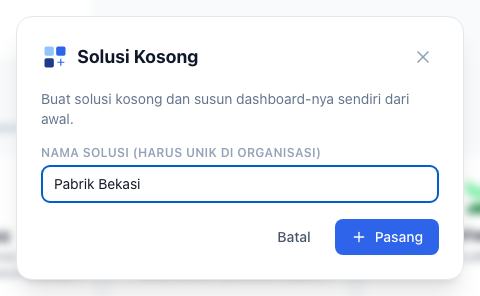
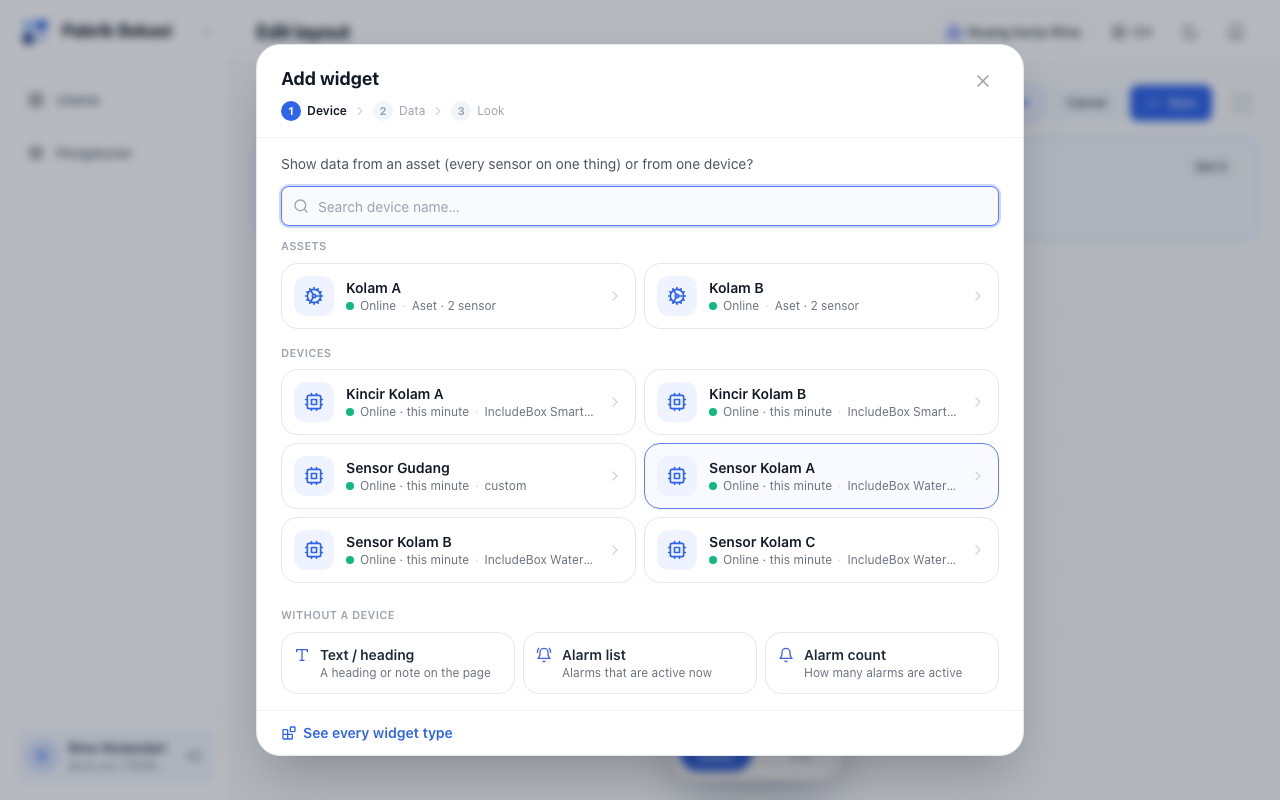
The editor opens with the Add widget window.
2. Add a widget
Three choices, in order:
- Device: where the data comes from. Under Assets, one asset brings every sensor mounted on it and its calculations; under Devices, one device. See Assets and calculations.
- Data: the reading. For an asset, readings are grouped by sensor. Its latest value is shown.
- Look: the form, for example a number card, a gauge, or a chart. Every option uses the real data.
Press Add to dashboard.
Want a whole page for one device or asset? After picking it, choose Build it for this device or Build it automatically for this asset.
3. Arrange and save
- Drag a widget to move it, drag its corner to resize it.
- Add widget or All widgets to add more.
- Press Save to save and leave the editor. Cancel leaves without saving.
To change it later, open the solution and press Edit layout.
4. Set up a widget
Double-click a widget, or press the settings icon at its top right. The panel on the right has three tabs, and every change shows on the widget straight away.
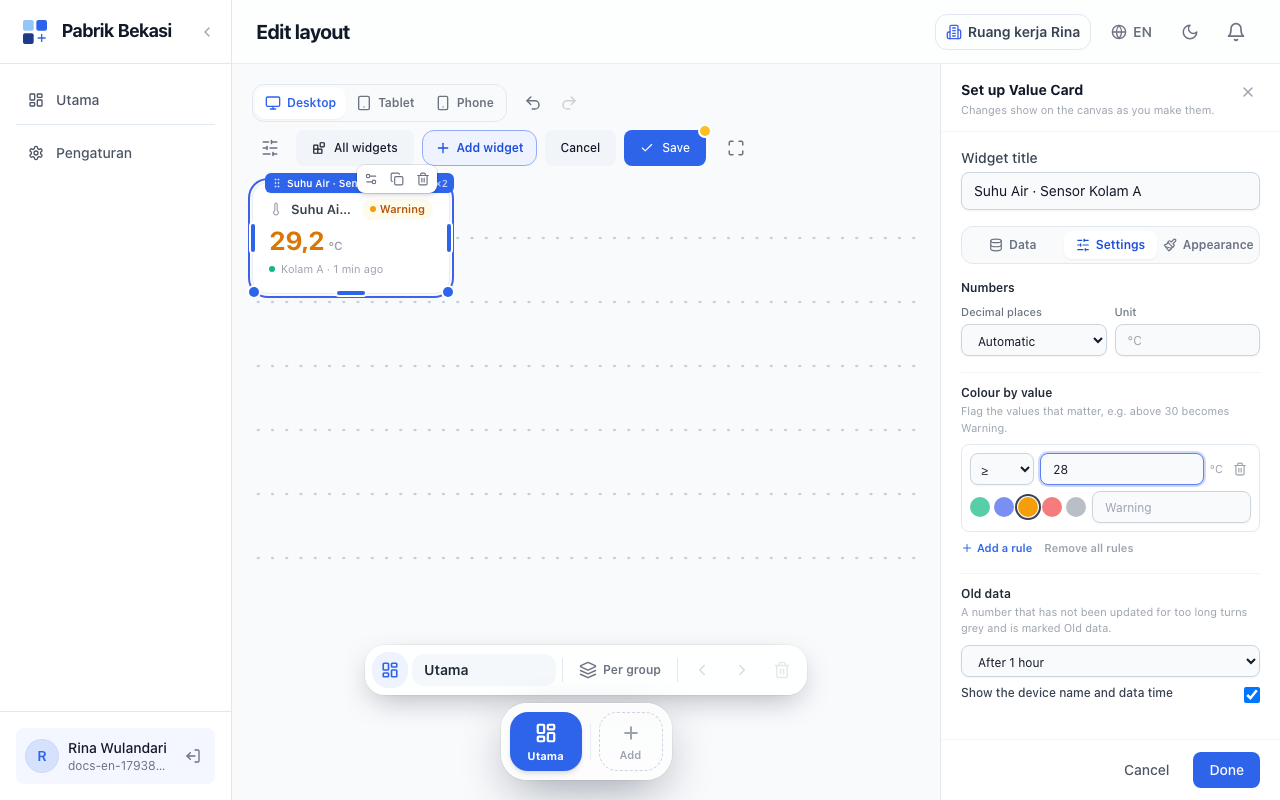
- Data: the device or asset, and the data shown.
- Settings: what makes the widget useful.
- Colour by value: press Add a rule, enter for example
≥ 30and pick yellow. Numbers above 30 change colour and are marked Warning. For data the platform knows, such as pH or soil moisture, pick Use the common range as a start. - Old data: a number that has not been updated for a while turns grey and is marked Old data. By default after 1 hour.
- For charts, pick a Type: Line or Bars over time. A line has three separate choices: Line shape (Straight, Smooth, or Steps), Line width, and Fill the area under the line, so a smooth or stepped line can go with or without an area. Bars from a kWh meter show usage per hour or per day by themselves.
- Colour by value: press Add a rule, enter for example
- Appearance: the colour of each data, the icon, background and corners.
Press Done to apply, then Save the dashboard.
Control widgets
Switch, Command Button, Slider, Number Input and Mode Selector send a command to the device over MQTT, on the command topic, as {"method": ..., "params": {"key": ..., "value": ...}}.
- Send the same value back in the device's data, under the same name (for example
relay). The widget then says Confirmed by the device. Without it, the widget can only say Sent. - For commands that must not go out on a mis-click, turn on Ask before sending in the Settings tab.
- See MQTT to receive commands on the device.
Device map
The Device Map widget shows the devices that have a location, coloured by status. A location is set on the device page. A device that sends its own latitude and longitude, such as a GPS tracker, can be followed: pick it under Follow one device (GPS).